Areas of expertise
City guides and monthly market data


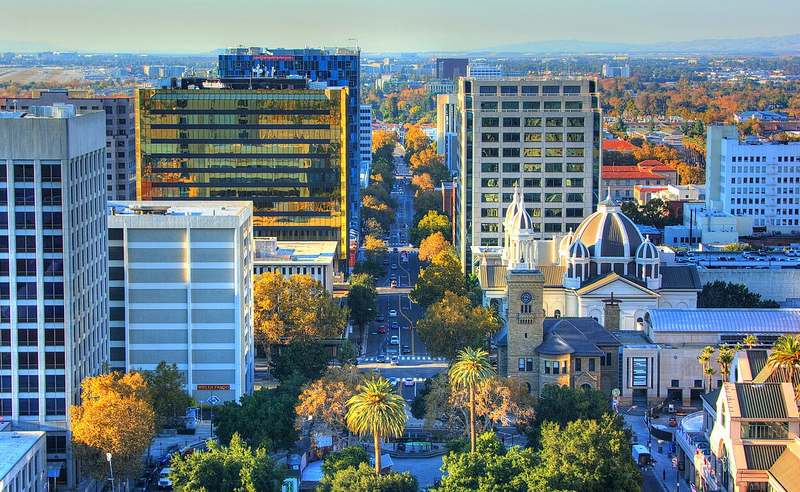 $36.8M in team salesSan JoseHouse median $1.62M
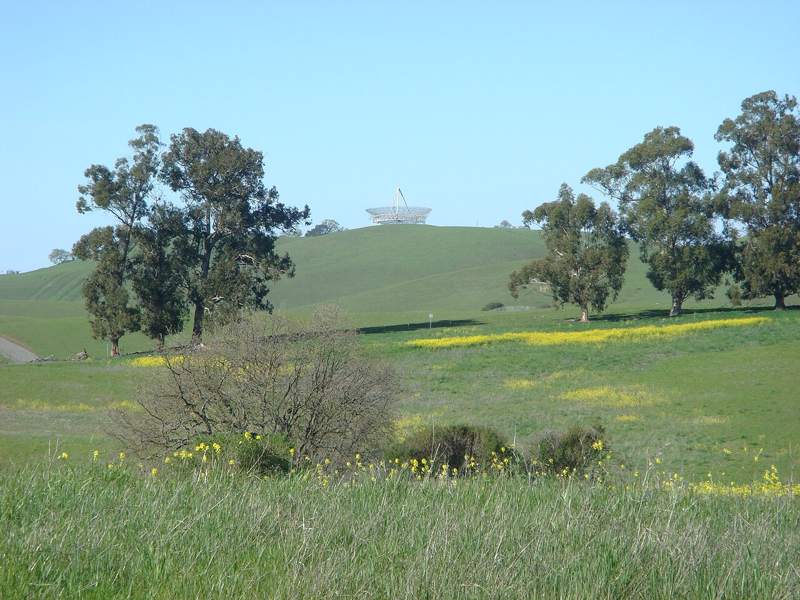 $14.3M in team salesLos Altos HillsHouse median $6.75M
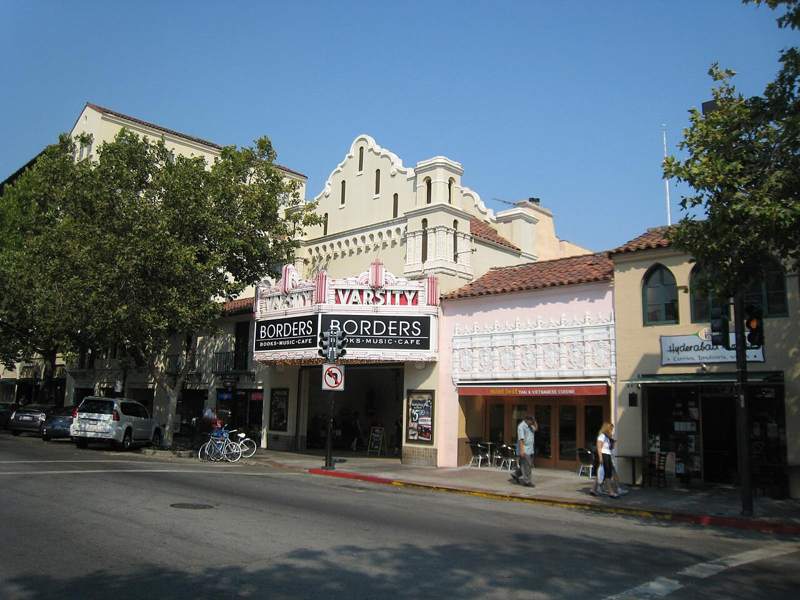 $11.9M in team salesPalo AltoHouse median $4.2M
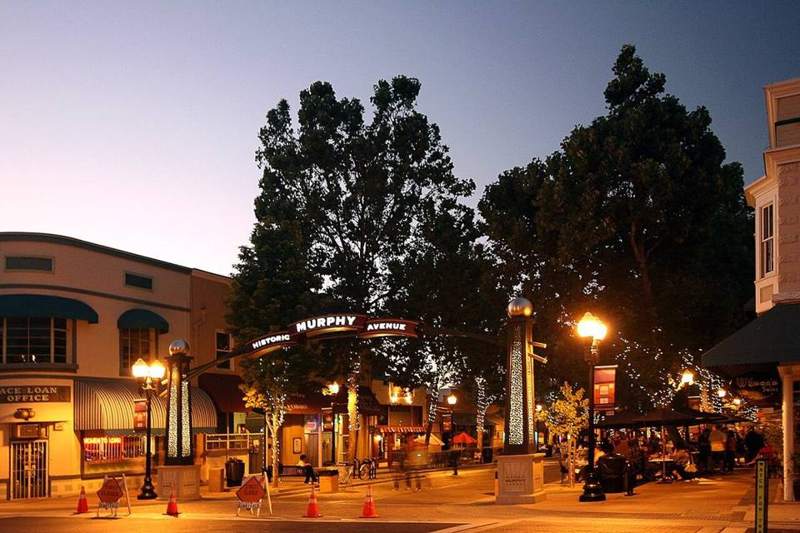 $8.36M in team salesSunnyvaleHouse median $2.6M
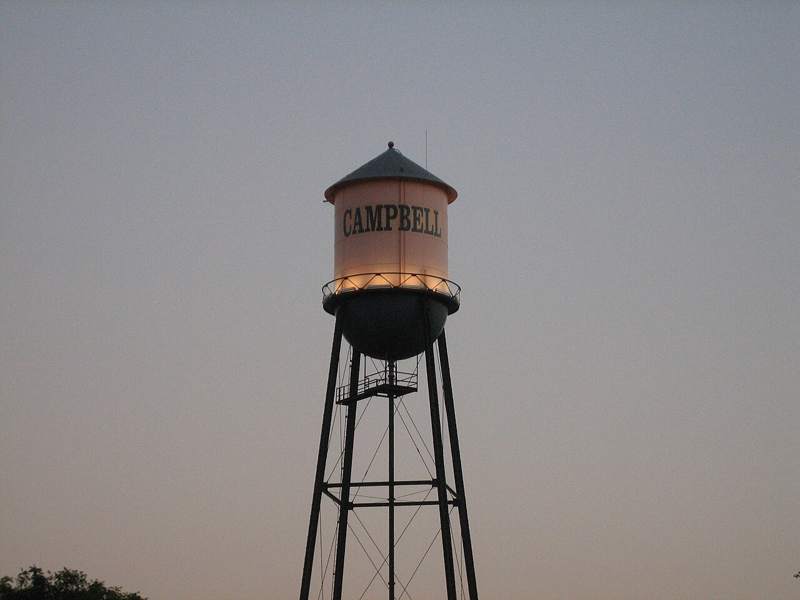 $8.36M in team salesCampbellHouse median $2M
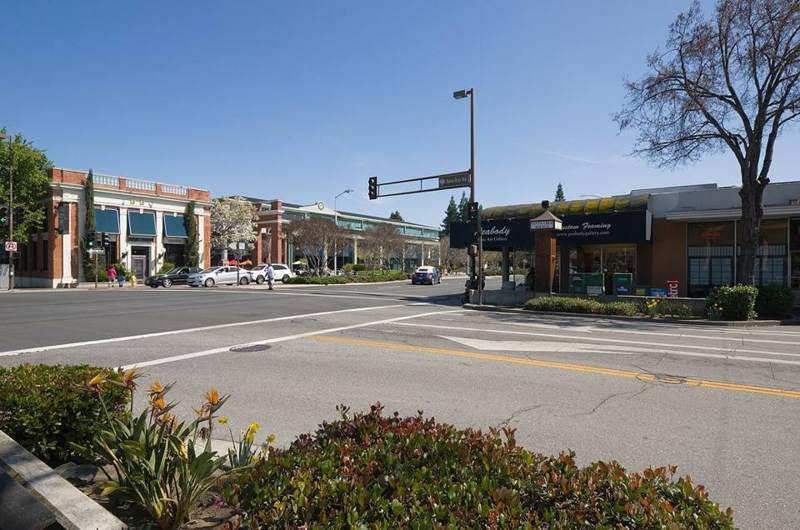 $8.19M in team salesMenlo ParkHouse median $4.11M
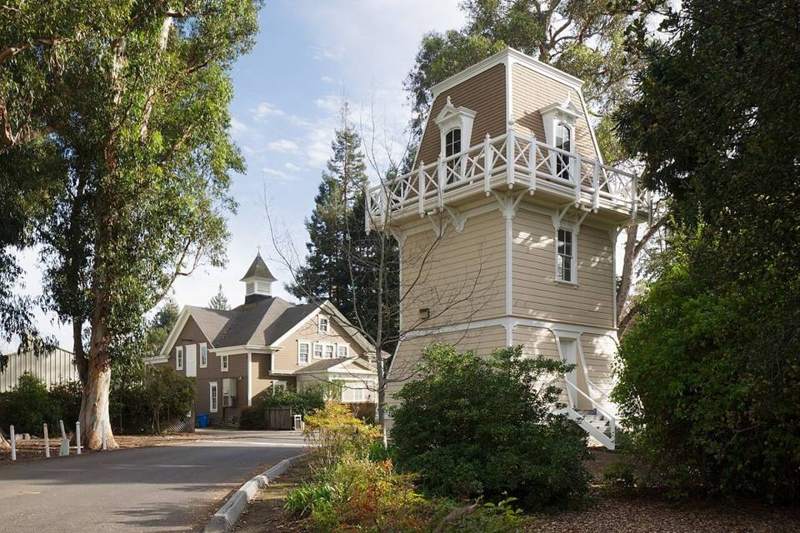 $4.85M in team salesAthertonHouse median $12M
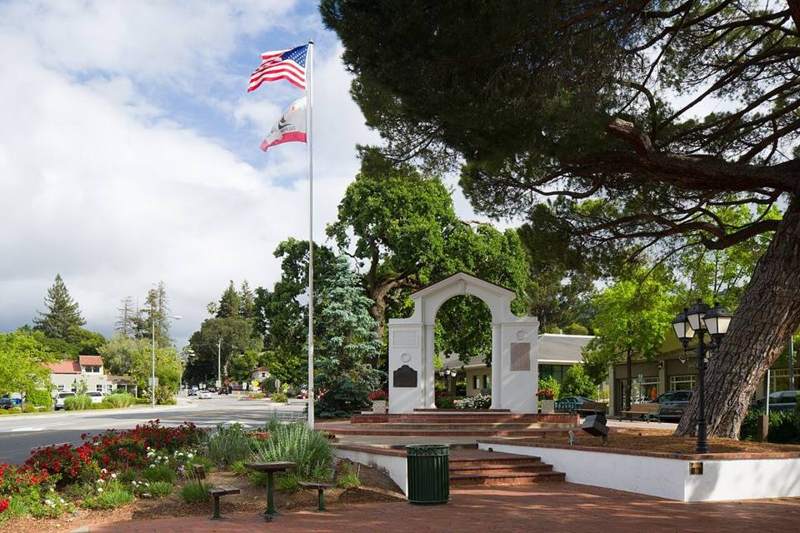 $4.75M in team salesSaratogaHouse median $4.3M
 $4.54M in team salesCupertinoHouse median $3.02M
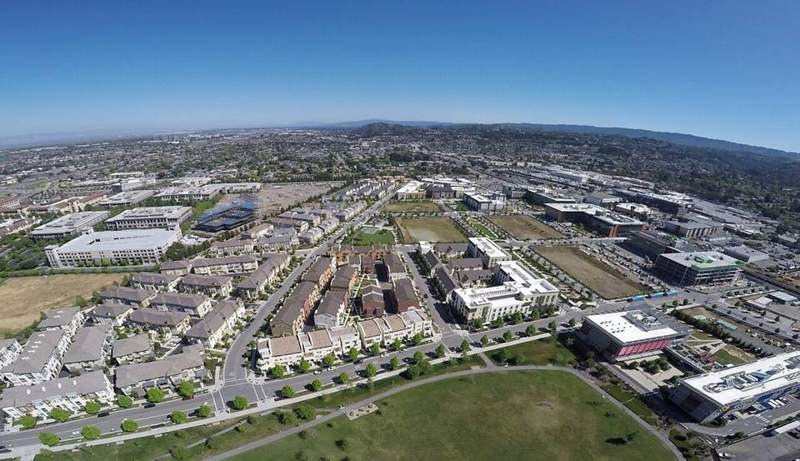 $3.75M in team salesSan MateoHouse median $2.05M
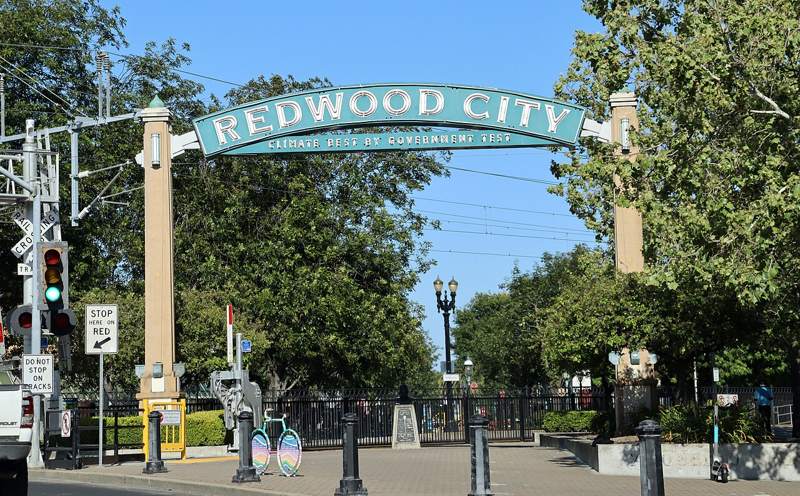 $2.92M in team salesRedwood CityHouse median $2.35M
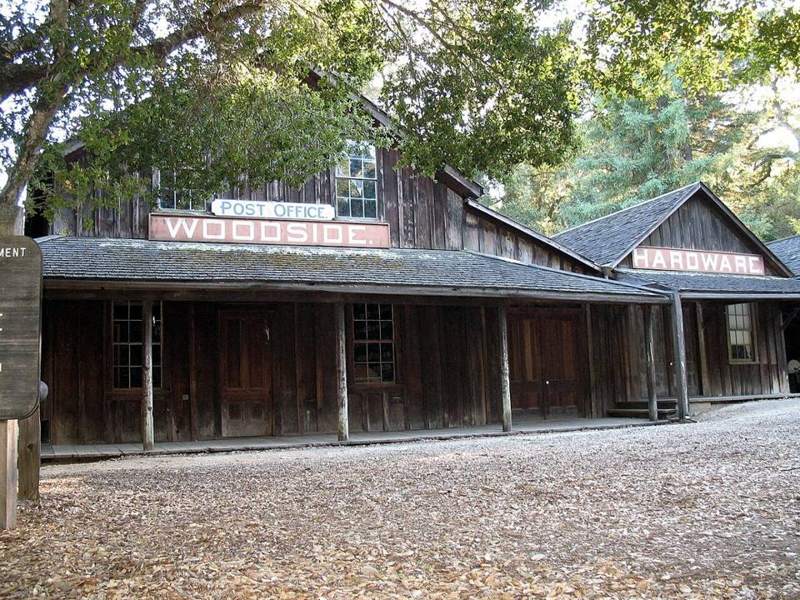 $2.8M in team salesWoodsideHouse median $4.62M
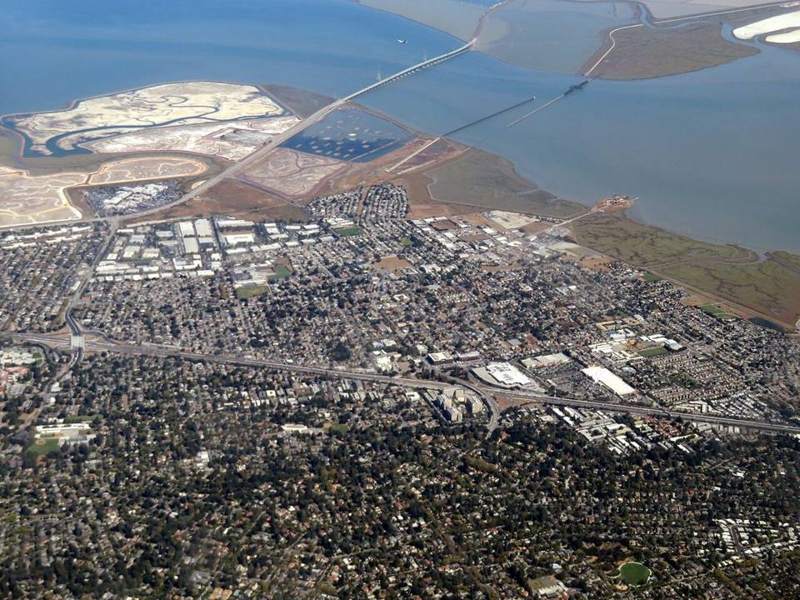 $2.62M in team salesEast Palo AltoHouse median $1M
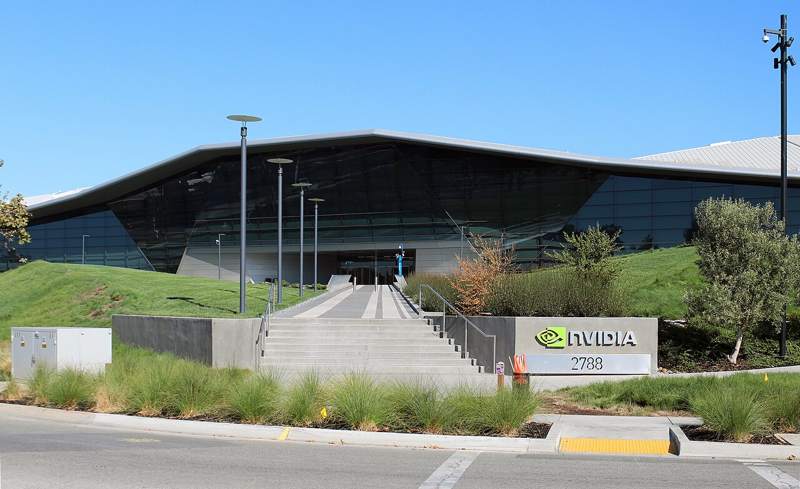 $1.41M in team salesSanta ClaraHouse median $1.85M
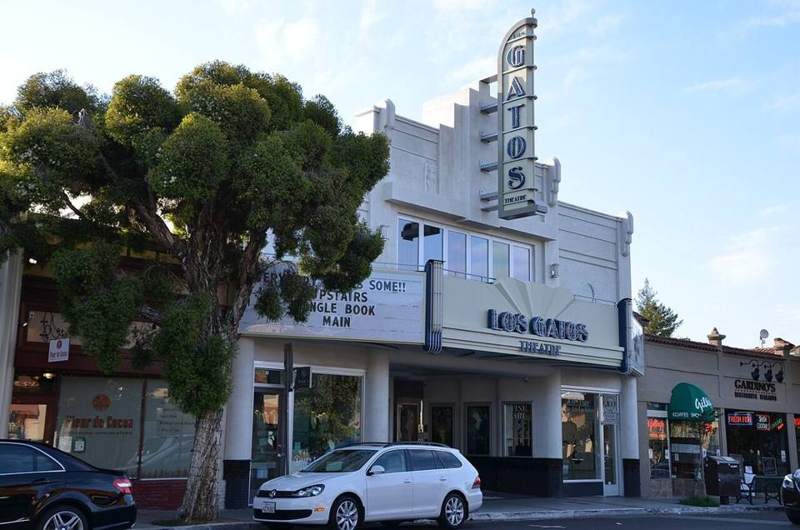 $795K in team salesLos GatosHouse median $2.87M
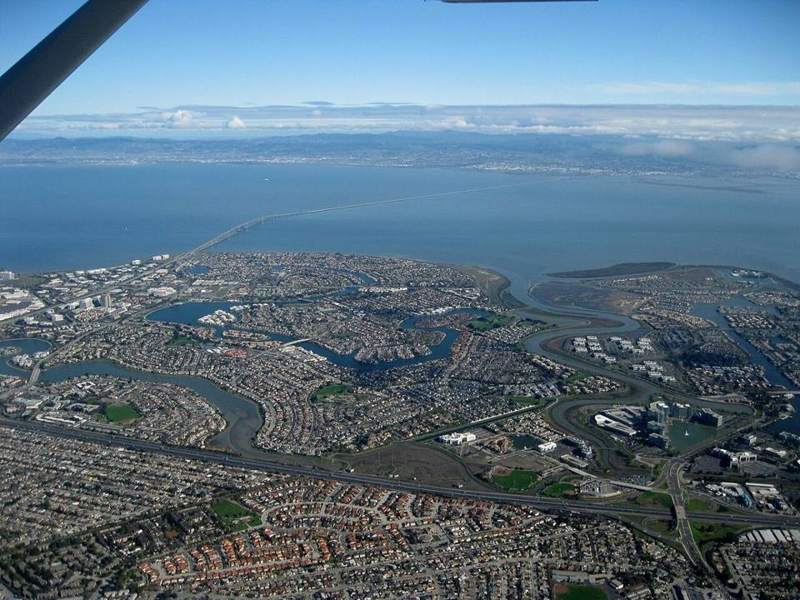 Foster CityHouse median $2.18M
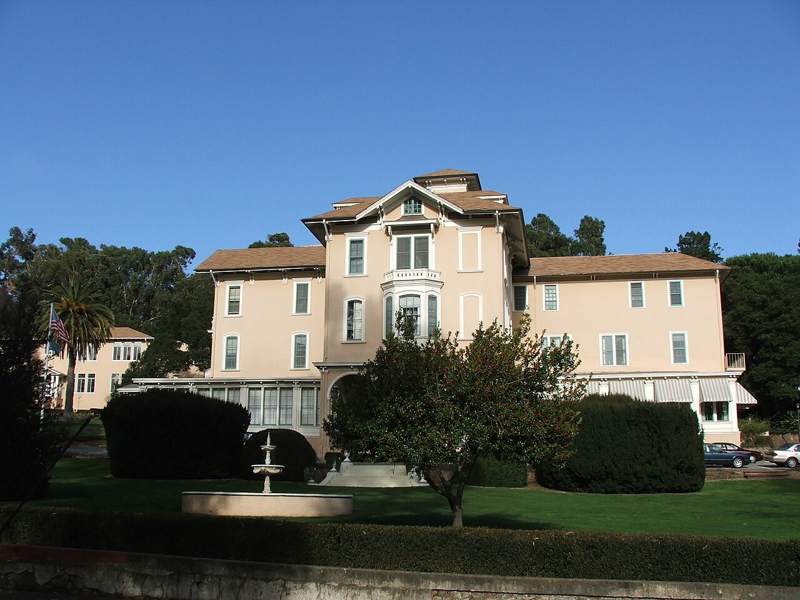 BelmontHouse median $2.42M
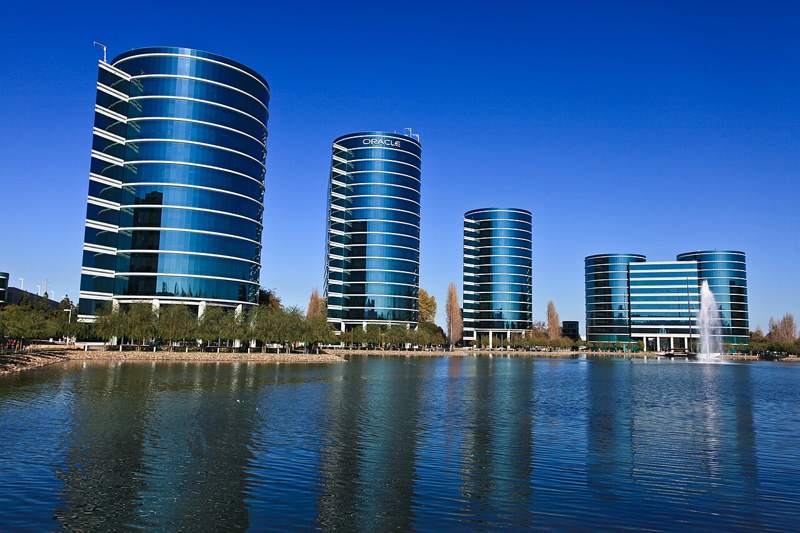 Redwood ShoresHouse median $2.49M
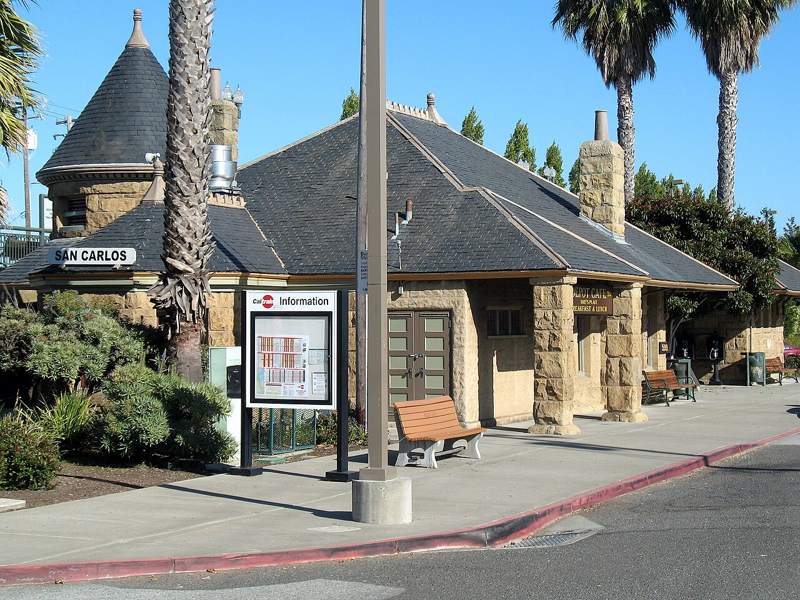 San CarlosHouse median $2.6M
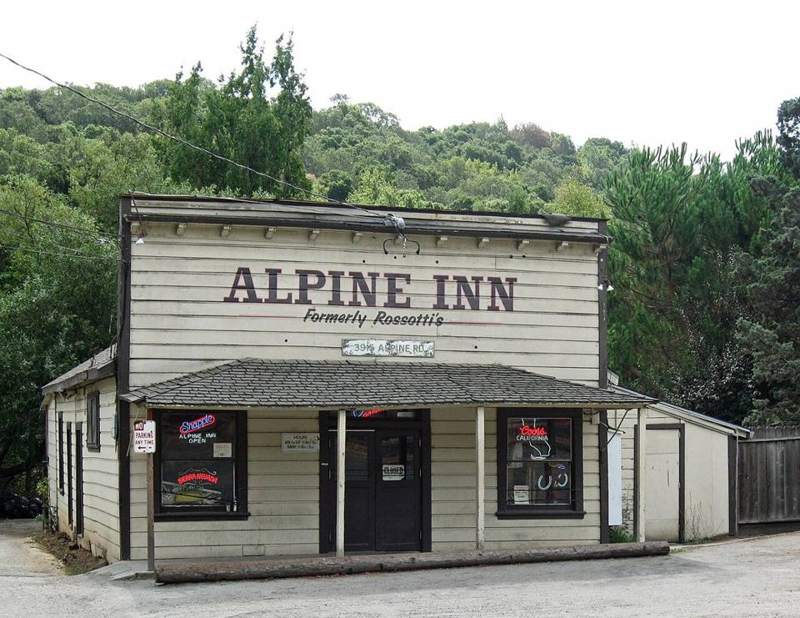 Portola ValleyHouse median $6.11M
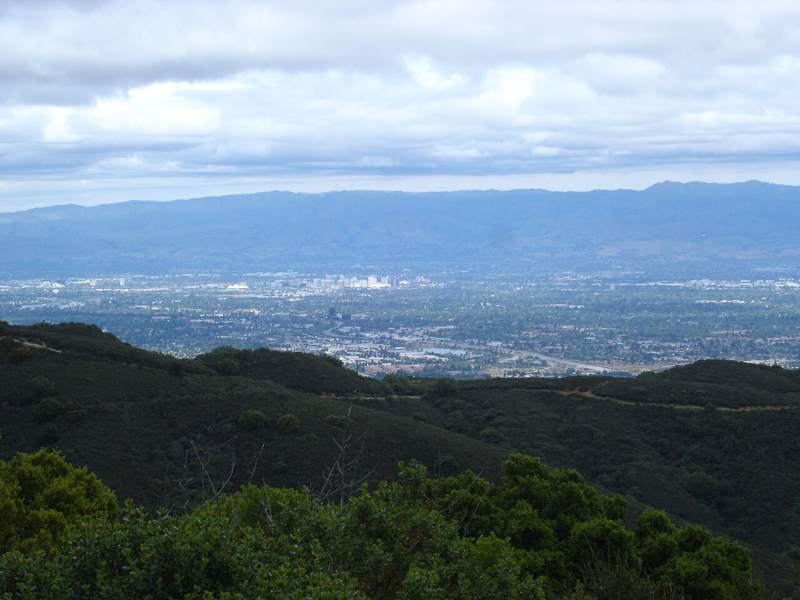 Monte SerenoHouse median $4.2M
Sean and his team have also sold homes in Union City, Long Beach, Concord, South San Francisco, San Francisco, Fremont, Gilroy, and Stockton.
Compare cities
July to September 2026. Updated monthly.
| City | Single-family median | Change from a year earlier | Price per sq ft | Median days on market | Sold above list, all types | Homes sold, all types |
|---|---|---|---|---|---|---|
| San Mateo | $2,049,183 | -0.1% | $1,341 | 11 | 51.9% | 204 |
| Foster City | $2,184,129 | +2.8% | $1,096 | 18 | 38.9% | 65 |
| Belmont | $2,424,034 | +5.4% | $1,276 | 16 | 53.8% | 55 |
| Redwood Shores | $2,489,372 | +5.8% | $1,275 | 15 | 43.1% | 37 |
| San Carlos | $2,599,963 | +2.6% | $1,489 | 10 | 56.5% | 86 |
| Redwood City | $2,354,062 | +10.5% | $1,351 | 13 | 57.5% | 145 |
| Woodside | $4,623,157 | +21.7% | $1,416 | 29 | 38.9% | 18 |
| Atherton | $11,995,218 | +65.2% | $2,401 | 19 | 52.4% | 21 |
| Menlo Park | $4,106,363 | +23.1% | $1,818 | 12 | 50.1% | 71 |
| Portola Valley | $6,112,563 | +32.9% | $1,644 | 29 | 50.0% | 12 |
| East Palo Alto | $1,002,101 | -7.3% | $857 | 25 | 25.8% | 31 |
| Palo Alto | $4,198,326 | +6.0% | $2,190 | 10 | 58.8% | 135 |
| Los Altos Hills | $6,747,310 | +20.5% | $1,654 | 34 | 25.9% | 27 |
| Los Altos | $4,906,044 | +7.0% | $2,152 | 8 | 60.1% | 76 |
| Mountain View | $2,924,834 | +10.7% | $1,743 | 10 | 55.3% | 131 |
| Sunnyvale | $2,603,962 | +2.1% | $1,522 | 12 | 60.6% | 233 |
| Cupertino | $3,018,797 | -11.1% | $1,630 | 12 | 54.6% | 76 |
| Saratoga | $4,298,286 | +0.4% | $1,584 | 19 | 49.9% | 79 |
| Los Gatos | $2,873,854 | -7.3% | $1,334 | 22 | 45.5% | 65 |
| Monte Sereno | $4,198,326 | -0.2% | $1,370 | 33 | 30.8% | 13 |
| Campbell | $1,999,203 | -6.3% | $1,164 | 21 | 37.1% | 71 |
| Santa Clara | $1,849,263 | -6.1% | $1,300 | 13 | 53.6% | 196 |
| San Jose | $1,620,854 | -2.6% | $956 | 17 | 42.5% | 1,492 |
Source: Redfin Data Center. Rolling three-month figures, July to September 2026. Price, price per square foot, and days on market are for single-family homes. Sold above list and homes sold cover all home types. Redwood Shores uses ZIP code 94065. Last updated October 20, 2026.
Compare any two citiesMountain View vs. SunnyvaleSunnyvale vs. Santa ClaraPalo Alto vs. Los AltosCondo vs. townhouse in San Jose