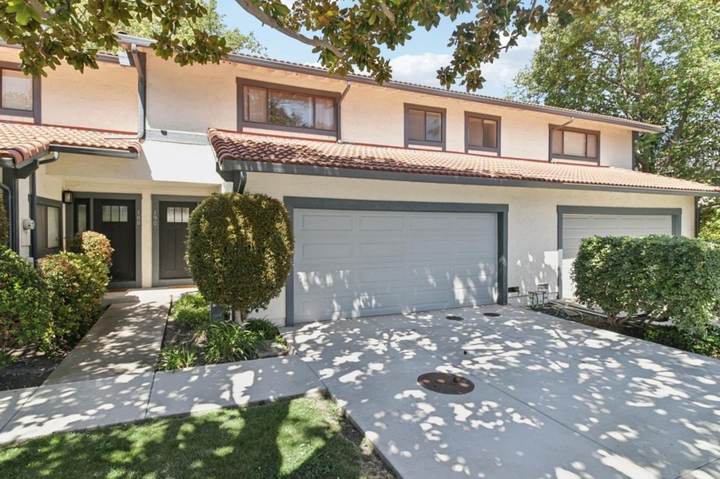
$1,725,000
190 Granada Dr
Mountain View, CA 94043
Homes, schools, and prices, side by side
July to September 2026. Updated monthly.
Single-family homes in Mountain View sold for a median of $2,924,834 from July to September 2026, $320,872 (12.3%) more than in Sunnyvale ($2,603,962). Over the last two years, Mountain View had the higher median in 19 of 25 three-month periods. The median house sold in 10 days in Mountain View and 12 days in Sunnyvale.
Mountain View and Sunnyvale share a border, the same freeways, and many of the same employers. The big differences are price, size, and school districts.
Sunnyvale has about twice the population of Mountain View and more single-family neighborhoods. Mountain View has one main K-8 district and one high school district. Sunnyvale addresses can fall in three K-8 districts and two high school districts.
Tell Sean what you need, and he will send homes in both. Or call or text 650-400-0686.
Real sales data, side by side.
| Measure | Mountain View | Sunnyvale | Difference |
|---|---|---|---|
| Median sale price | $2,924,834 | $2,603,962 | $320,872 more in Mountain View (12.3%) |
| Change from a year earlier | +10.7% | +2.1% | 8.6 points higher in Mountain View |
| Median price per sq ft | $1,743 | $1,522 | $221 more in Mountain View (14.5%) |
| Homes sold | 61 | 140 | 79 more in Sunnyvale |
| Median days on market | 10 | 12 | 2 days longer in Sunnyvale |
| Average sale-to-list ratio | 107.4% | 106.1% | 1.3 points higher in Mountain View |
| Sold above list price | 65.0% | 71.0% | 6.0 points higher in Sunnyvale |
| Homes for sale | 28 | 46 | 18 more in Sunnyvale |
| Months of supply | 1.4 | 1.0 | 0.4 more in Mountain View |
| Home type | Mountain View median | Mountain View sales | Sunnyvale median | Sunnyvale sales |
|---|---|---|---|---|
| Single-family | $2,924,834 | 61 | $2,603,962 | 140 |
| Townhouse | $1,510,018 | 42 | $1,350,016 | 54 |
| Condo | $754,922 | 26 | $769,921 | 30 |
Each point covers three months of sales ending that month.
| Three months ending | Mountain View | Sunnyvale |
|---|---|---|
| September 2026 | $2,924,834 | $2,603,962 |
| August 2026 | $2,886,000 | $2,605,000 |
| July 2026 | $3,038,250 | $2,725,000 |
| June 2026 | $3,090,000 | $2,667,500 |
| May 2026 | $3,080,000 | $2,680,000 |
| April 2026 | $3,050,000 | $2,628,000 |
| March 2026 | $3,001,500 | $2,760,000 |
| February 2026 | $3,035,000 | $2,537,500 |
| January 2026 | $2,787,250 | $2,500,000 |
| December 2025 | $2,777,500 | $2,600,000 |
| November 2025 | $2,649,500 | $2,691,500 |
| October 2025 | $2,684,000 | $2,726,500 |
| September 2025 | $2,642,000 | $2,550,000 |
| August 2025 | $2,775,000 | $2,572,500 |
| July 2025 | $2,700,000 | $2,612,750 |
| June 2025 | $2,625,000 | $2,700,750 |
| May 2025 | $2,566,000 | $2,750,000 |
| April 2025 | $2,650,000 | $2,775,000 |
| March 2025 | $2,770,000 | $2,755,000 |
| February 2025 | $2,800,000 | $2,524,000 |
| January 2025 | $2,837,500 | $2,600,000 |
| December 2024 | $2,700,000 | $2,600,000 |
| November 2024 | $2,700,000 | $2,610,000 |
| October 2024 | $2,680,000 | $2,600,000 |
| September 2024 | $2,550,000 | $2,550,000 |
| Topic | Mountain View | Sunnyvale |
|---|---|---|
| County | Santa Clara County | Santa Clara County |
| Population (2020 Census) | 82,376 | 155,805 |
| K-8 school district | Mountain View Whisman School District for most addresses. Los Altos School District for some addresses in the south. | Sunnyvale School District for most addresses. Cupertino Union in parts of the south and west. Santa Clara Unified in some areas. |
| High school district | Mountain View-Los Altos Union High School District | Fremont Union High School District or Santa Clara Unified, by address |
| Caltrain stations | Mountain View, San Antonio | Sunnyvale, Lawrence |
| VTA light rail | Yes, from downtown toward Sunnyvale and San Jose | Yes, on the north side |
| Downtown | Castro Street | Murphy Avenue and CityLine |
| Common home types | Post-war houses, Eichlers, and many newer townhomes and condos | Post-war houses, Eichlers, and many townhomes and condos |
| District or school | English: Proficient or Advanced | Math: Proficient or Advanced | Students tested (English) |
|---|---|---|---|
| Mountain View Whisman School District | 64.5% | 60.5% | 2,904 |
| Los Altos School District | 87.4% | 86.8% | 2,210 |
| Mountain View-Los Altos Union High School District | 81.6% | 68.1% | 1,026 |
| Mountain View High School | 88.3% | 72.6% | 514 |
| Los Altos High School | 77.3% | 66.5% | 481 |
| District or school | English: Proficient or Advanced | Math: Proficient or Advanced | Students tested (English) |
|---|---|---|---|
| Sunnyvale School District | 55.6% | 53.8% | 3,500 |
| Cupertino Union School District | 79.7% | 83.7% | 8,774 |
| Santa Clara Unified School District | 60.6% | 50.2% | 6,867 |
| Fremont Union High School District | 79.6% | 72.4% | 2,057 |
| Fremont High School | 57.9% | 41.8% | 470 |
| Homestead High School | 80.8% | 70.3% | 473 |
Source: California Department of Education, CAASPP Smarter Balanced test results, 2025-26 school year. Share of all students tested, in grades 3 to 8 and 11, who scored at the two highest of four levels: Proficient or Advanced. Before 2026 the state called these levels Standard Met and Standard Exceeded. District rows cover every school in the district. Updated each fall when the state posts new results; last updated October 20, 2026. Test results are one measure. See the California School Dashboard for others, and confirm school assignments for any address with the district.
Source: the Redfin Data Center, Mountain View and Sunnyvale. Figures cover home sales from July to September 2026, a rolling three-month period, by home type. Updated monthly; last updated October 20, 2026. Population from the 2020 U.S. Census where shown. School districts from the districts. Deemed reliable but not guaranteed. Confirm school assignments for any address with the district.
Both cities have post-war single-family neighborhoods, Eichler tracts, and a large share of townhomes and condos. In both, the citywide median moves with the mix of homes that sold, so compare the same home type.
Mountain View's larger single-family lots sit in Cuesta Park and Waverly Park, south of El Camino Real. Sunnyvale's include Cherry Chase and Cumberland, near the Cupertino border.
Mountain View has rent stabilization rules for many apartments. If you plan to buy a rental property there, check which rules apply.
School districts are the main practical difference. Most Mountain View addresses feed into one K-8 district and the Mountain View-Los Altos high school district, which runs Mountain View High and Los Altos High.
Sunnyvale is split. The same city can send one street to Sunnyvale School District and the next to Cupertino Union, with high school in Fremont Union or Santa Clara Unified. Two Sunnyvale houses a mile apart can have different assigned schools and different prices.
Look up the assigned schools for each address with the district, then check test results and other measures on the California School Dashboard.
Test results and other measures for every public school: California School Dashboard.
Both cities sit on US-101, SR-85, SR-237, and Central Expressway, and both have two Caltrain stations and VTA light rail. Sunnyvale also borders I-280 on its south edge. Commute times between the two are usually similar. The bigger factor is which part of each city you live in.
This page compares homes and market data. It is general information, not legal, tax, or financial advice.
22 homes in Mountain View and Sunnyvale, $31,485,000
$1,725,000
Mountain View, CA 94043
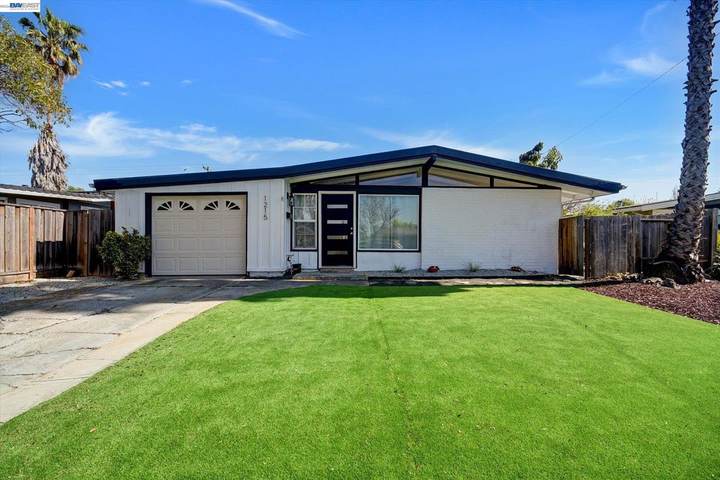
$1,650,000
Sunnyvale, CA 94089

$5,738,000
Mountain View, CA 94041

$1,610,000
Mountain View, CA 94043

$1,500,000
Mountain View, CA 94043

$565,000
Mountain View, CA 94040

$2,725,000
Mountain View, CA 94040

$2,480,000
Mountain View, CA 94040

$2,400,000
Mountain View, CA 94040

$1,150,000
Mountain View, CA 94041

$425,000
Sunnyvale, CA 94085

$1,010,000
Mountain View, CA 94043
$1,125,000
Sunnyvale, CA 94087

$1,210,000
Mountain View, CA 94040

$597,000
Sunnyvale, CA 94086

$900,000
Sunnyvale, CA 94087

$1,000,000
Sunnyvale, CA 94087

$927,500
Sunnyvale, CA 94086

$940,000
Sunnyvale, CA 94087

$795,000
Sunnyvale, CA 94085

$575,000
Mountain View, CA 94041

$437,500
Mountain View, CA 94040
Mountain View, for single-family homes. From July to September 2026, the single-family median was $2,924,834 in Mountain View and $2,603,962 in Sunnyvale, according to Redfin. Price per square foot was $1,743 in Mountain View and $1,522 in Sunnyvale.
From July to September 2026, the median single-family home spent 10 days on the market in Mountain View and 12 days in Sunnyvale. 65.0% of Mountain View houses and 71.0% of Sunnyvale houses sold above list price.
Most of Mountain View is in the Mountain View Whisman School District for kindergarten through 8th grade and the Mountain View-Los Altos Union High School District for high school. Some south Mountain View addresses are in the Los Altos School District. Sunnyvale is split among the Sunnyvale School District, Cupertino Union, and Santa Clara Unified for kindergarten through 8th grade, and Fremont Union or Santa Clara Unified for high school. Confirm the schools for any address with the district.
Sean Rossiter is a Senior Premier Agent at Redfin based in Mountain View, California DRE #02105207. Call or text 650-400-0686 or email sean@seanrossiter.com.
Mountain View city guideSunnyvale city guideSunnyvale vs. Santa ClaraPalo Alto vs. Los AltosCondo vs. townhouse in San JoseCompare any two cities
Get a price range for your home based on recent sales nearby.
Get my home value